
System performance analytics seems to be a frequent question on forums and mailing lists. Finding out why something is slow is generally nontrivial as there are many factors to consider. It’s really very tough job for every System or Network administrator to monitor and debug Linux System Performance problems every day.
After being a Linux Administrator for 8 years in IT industry, we came to know that how hard is to monitor and keep systems up and running. For this reason, we’ve compiled the list of Top 10 command line system monitoring & performance tools that might be useful for every Linux/Unix System Administrator.
Also Read: Top 9 Log Monitoring Tools
These commands are available under all flavors of Linux and can be useful to monitor and find the actual causes of performance problem. This list of commands shown here are very enough for you to pick the one that is suitable for your monitoring scenario.
Unix has following major resource types that need to be monitored and tuned which are:
CPU, Memory, Disk space, Communications lines, I/O Time, Network Time and Applications programs
“Linux provides the following important tools to measure and fine-tune system performance as seen with appoptics.com, which are as follows:”
1. free Command
This command displays all the necessary information about system physical (RAM) and swap memory which is in KB and if you want to display all size in MB then the command is “free -mt” Where t attribute displays the Total line which is the sum of physical and swap memory values.
Command: free

In this case, our total physical memory on this system is 4GB.
2. top Command
It displays real time information about various performance metrics of the system such as CPU Load, Memory Usage, Processes List etc
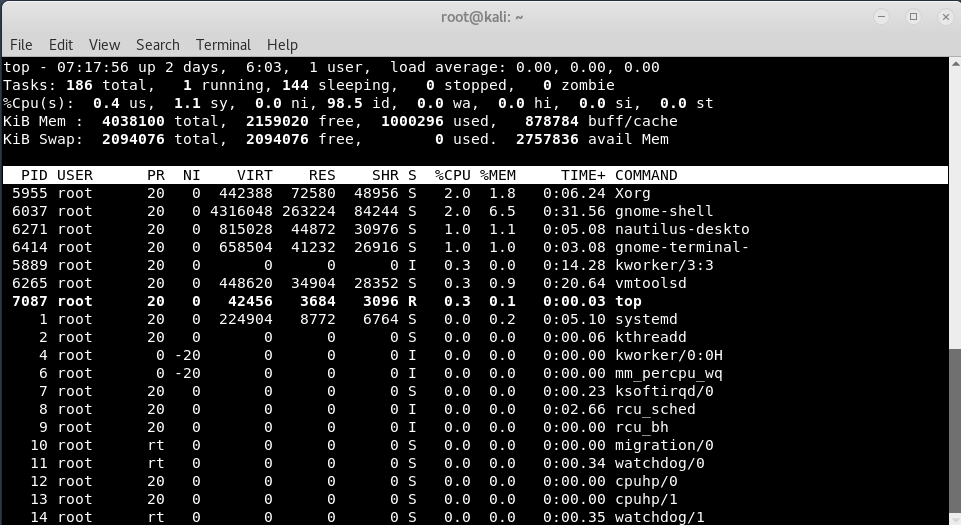
Command: top
Press q if you want to exit from this command.
Here you can see that,
- Line 1 “top“, indicates that the system has been up and running for 2 days.
- Line 2 “Tasks“, displays the total number of processes along with a breakdown of running, sleeping, stopped and zombie processes count.
- Line 3 “Cpu(s)” displays the current CPU utilization of the system. In this example, CPU is 98.5% idle
- Line 4 “Mem” and Line 5 “Swap” provides the memory information. This is the same information from the free command.
- The rest of the lines display all the active processes on the system, sorted default by CPU usage (%CPU column). i.e the most CPU intensive processes will be displayed on the top by default.
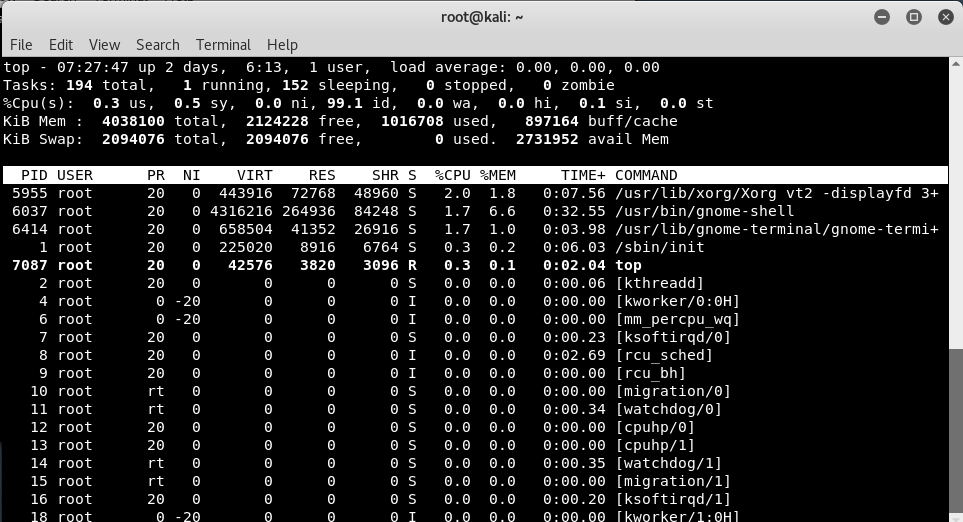
Press c if you want to display the full path of running processes as shown below:
Press 1 which will display the performance data of the individual CPUs on that machine as shown below:

3. ps Command
This command will display snapshot information of all active processes.
Command: ps
And if you want to display all the processes running in same system then the command is “ps aux | more”

You can also use “ps -ef | more” to get a similar output:

In case, if you want to display the output in form of TREE, then the command is “ps axuf” which actually helps you to visualize the process and its parent process immediately as shown below:

You can also view all the processes owned by particular user. Let’s for example if you want to see all the processes for root user then the command will be “ps U root” which will display all the processes owned by root user only.

Following command will display all the processes owned by current user only.
Command: ps U $USER

4. df Command
This command basically displays the amount of total and free disk space available on the mounted file systems.
Command: df

By typing “df -h“, displays the values in human readable format.

Here you can see that, the available space in our system is 61GB.
And in case, if you want to display the filesystem type along with all above information, then the command is “df -Tha“.


5. du Command
This command will print the file space usage for a particular directory and its subdirectories.
Command: du -sh ~
Here -s stands for summary only and -h will display the value in human readable format which is 303M in our case.

6. ls0f Command
Lsof stands for ls open files, which will list all the open files in the system. The open files include network connection, devices and directories.
Command: lsof | more

And in case, if you want to find out all the information for a particular user then the command is “lsof -u root” as shown below:

You can also print all the information for a particular file or process.
For Example, here we are running gdisk command in other terminal and then type “lsof /sbin/gdisk” in next terminal which gives you all the information about this file/process only as shown below:

7. sar Command
Sar commands comes with the sysstat package. Make sure sysstat is installed. If you don’t have sar installed on your system, then you can install it by typing “apt-get install sysstat” as shown below:
Sar is an excellent monitoring tool that displays performance data of pretty much every resource of the system including CPU, memory, IO, paging, networking, interrupts etc. Sar also collects, reports (displays) and saves the performance data.

After installation, if you see some kind of read file error, then you need to reconfigure the package by typing “dpkg-reconfigure sysstat” as shown below:

Type “sar -u” will display all the information about CPU statistics and in case if you want to display the output for individual CPUs then the command is “sar -u -P ALL” as shown below:

The command: “sar -d” will display the Disk IO statistics”

For Networking statistics, the command is “sar -n DEV | more“.

8. vmstat Command
For a typical performance monitoring all you need is only vmstat command which display memory, swap, IO, system and CPU performance information. The following command executes vmstat every 1 second for 100 times.
Command: vmstat 1 100

Here,
- r field: Total number of runnable process
- b field: Total number of blocked process
- Swpd field: Used swap space
- Free field: Available free RAM
- Buff field: RAM used for buffers
- Cache field: RAM used for filesystem cache
- Si field: Amount of memory swapped from disk per second
- So field: Amount of memory swapped to disk per second
- Bi field: Blocks received from disk
- Bo field: Blocks sent to disk.
- In field: Number of interrupts per second.
- Cs field: Number of context switches per second.
- Us field: Time spend running user code. (non-kernel code)
- Sy field: Time spent running kernel code.
- Id field: Idle time.
- Wa field: Time spent waiting for the IO
9. netstat Command
Netstat command displays the network related information such as network connections, routing tables, interface statistics.
To display active internet connections and domain sockets the command is:
Command: netstat -an

To display active connections with Process ID and Program Name, the command is “netstat -tap”

and for routing table, the command is “netstat -route“.

For raw network statistics, the command is “netstat –statistics –raw“.

10. sysctl Command
Linux kernel parameter can be changed on the fly using sysctl command. Sysctl helps to configure the Linux kernel parameters during runtime.
Command: sysctl -a


